Search for Indicators
Dane County Healthy Homes & Communities Dashboard
Indicator Gauge Icon Legend
Legend Colors
Red is bad, green is good, blue is not statistically different/neutral.
Compared to Distribution
 the value is in the best half of communities.
 the value is in the 2nd worst quarter of communities.
 the value is in the worst quarter of communities.
Compared to Target
 meets target;
  does not meet target.
Compared to a Single Value
 lower than the comparison value;
 higher than the comparison value;
 not statistically different from comparison value.
Trend

 non-significant change over time;
 significant change over time;
  no change over time.
Compared to Prior Value
 higher than the previous measurement period;
 lower than the previous measurement period;
 no statistically different change from previous measurement period.
Health / Alcohol & Drug Use
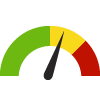
Adults who Binge Drink County: Dane
Adults who Binge Drink County: Dane
22.4%
(2020-2022)
Compared to:
WI Counties
The distribution is based on data from 54 Wisconsin counties.
WI Value
(23.4%)
The regional value is compared to the Wisconsin State value.
Prior Value
(21.9%)
Prior Value compares a measured value with the previously measured value. Confidence intervals were taken into account in determining the direction of the comparison.
Trend
This comparison measures the indicator’s values over multiple time periods.<br>The Mann-Kendall Test for Statistical Significance is used to evaluate the trend<br>over 4 to 10 periods of measure, subject to data availability and comparability.
Health / Alcohol & Drug Use
Age-Adjusted Hospitalization Rate due to Adult Alcohol Use
Value
Compared to:
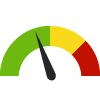
Age-Adjusted Hospitalization Rate due to Adult Alcohol Use County: Dane
Age-Adjusted Hospitalization Rate due to Adult Alcohol Use County: Dane
21.8
Hospitalizations per 10,000 population 18+ years
(2020-2022)
Compared to:

WI Counties
The distribution is based on data from 71 Wisconsin counties.
WI Value
(24.8)
The regional value is compared to the Wisconsin State value.
Prior Value
(22.5)
Prior Value compares a measured value with the previously measured value. Confidence intervals were taken into account in determining the direction of the comparison.
Trend
This comparison measures the indicator’s values over multiple time periods.<br>The Mann-Kendall Test for Statistical Significance is used to evaluate the trend<br>over 4 to 10 periods of measure, subject to data availability and comparability.
Death Rate due to Drug Poisoning County: Dane
Death Rate due to Drug Poisoning County: Dane
26.0
Deaths per 100,000 population
(2019-2021)
Compared to:


WI Counties
The distribution is based on data from 53 Wisconsin counties.
U.S. Counties
The distribution is based on data from 1,899 U.S. counties and county equivalents.
WI Value
(25.7)
The regional value is compared to the Wisconsin State value.
US Value
(27.2)
The regional value is compared to the national value.
HP 2030 Target
(20.7)
<div>SU-03: Reduce drug overdose deaths <strong>(LEADING HEALTH INDICATOR)</strong></div>
Health / Children's Health
Children Reported as Lead Poisoned County: Dane
Children Reported as Lead Poisoned County: Dane
0.5%
(2020)
Compared to:
Prior Value
(0.8%)
Prior Value compares a measured value with the previously measured value. Confidence intervals were not taken into account in determining the direction of the comparison.
Trend
This comparison measures the indicator’s values over multiple time periods.<br>The Mann-Kendall Test for Statistical Significance is used to evaluate the trend<br>over 4 to 10 periods of measure, subject to data availability and comparability.
Health / County Health Rankings
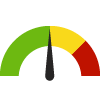
Physical Environment Ranking County: Dane
Physical Environment Ranking County: Dane
43
(2023)
Compared to:
WI Counties
The distribution is based on data from 72 Wisconsin counties.
Social and Economic Factors Ranking County: Dane
Social and Economic Factors Ranking County: Dane
5
(2023)
Compared to:
WI Counties
The distribution is based on data from 72 Wisconsin counties.
Health / Oral Health
Dentist Rate County: Dane
Dentist Rate County: Dane
75
Dentists per 100,000 population
(2022)
Compared to:

WI Counties
The distribution is based on data from 72 Wisconsin counties.
U.S. Counties
The distribution is based on data from 3,054 U.S. counties and county equivalents.
WI Value
(73)
The regional value is compared to the Wisconsin State value.
Prior Value
(73)
Prior Value compares a measured value with the previously measured value. Confidence intervals were not taken into account in determining the direction of the comparison.
Trend
This comparison measures the indicator’s values over multiple time periods.<br>The Mann-Kendall Test for Statistical Significance is used to evaluate the trend<br>over 4 to 10 periods of measure, subject to data availability and comparability.
Health / Tobacco Use
Adults who Smoke County: Dane
Adults who Smoke County: Dane
9.1%
(2020-2022)
Compared to:
WI Counties
The distribution is based on data from 56 Wisconsin counties.
WI Value
(15.1%)
The regional value is compared to the Wisconsin State value.
Prior Value
(9.7%)
Prior Value compares a measured value with the previously measured value. Confidence intervals were taken into account in determining the direction of the comparison.
Trend
This comparison measures the indicator’s values over multiple time periods.<br>The Mann-Kendall Test for Statistical Significance is used to evaluate the trend<br>over 4 to 10 periods of measure, subject to data availability and comparability.
HP 2030 Target
(6.1%)
<div>TU-02: Reduce current cigarette smoking in adults <strong>(LEADING HEALTH INDICATOR)</strong></div>
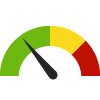
Compliance for Nicotine and Tobacco Sales County: Dane
Compliance for Nicotine and Tobacco Sales County: Dane
86.0%
Percent compliant
(2019)
Compared to:


Prior Value
(97.6%)
Prior Value compares a measured value with the previously measured value. Confidence intervals were not taken into account in determining the direction of the comparison.
Trend
This comparison measures the indicator’s values over multiple time periods.<br>The Mann-Kendall Test for Statistical Significance is used to evaluate the trend<br>over 4 to 10 periods of measure, subject to data availability and comparability.
Economy / Food Insecurity
Food Insecurity Rate County: Dane
Food Insecurity Rate County: Dane
6.1%
(2021)
Compared to:

WI Counties
The distribution is based on data from 72 Wisconsin counties.
U.S. Counties
The distribution is based on data from 3,140 U.S. counties and county equivalents.
WI Value
(7.2%)
The regional value is compared to the Wisconsin State value.
US Value
(10.4%)
The regional value is compared to the national value.
Prior Value
(7.0%)
Prior Value compares a measured value with the previously measured value. Confidence intervals were not taken into account in determining the direction of the comparison.
Trend
This comparison measures the indicator’s values over multiple time periods.<br>The Mann-Kendall Test for Statistical Significance is used to evaluate the trend<br>over 4 to 10 periods of measure, subject to data availability and comparability.
Environmental Health / Built Environment
Radon Test Results ≥4pCi/L County: Dane
Radon Test Results ≥4pCi/L County: Dane
44.2%
(2020)
Compared to:
Prior Value
(46.0%)
Prior Value compares a measured value with the previously measured value. Confidence intervals were not taken into account in determining the direction of the comparison.
Trend
This comparison measures the indicator’s values over multiple time periods.<br>The Mann-Kendall Test for Statistical Significance is used to evaluate the trend<br>over 4 to 10 periods of measure, subject to data availability and comparability.
Environmental Health / Toxins & Contaminants
Houses Built Prior to 1950 County: Dane
Houses Built Prior to 1950 County: Dane
14.5%
(2018-2022)
Compared to:
WI Counties
The distribution is based on data from 72 Wisconsin counties.
U.S. Counties
The distribution is based on data from 3,133 U.S. counties and county equivalents.
WI Value
(23.9%)
The regional value is compared to the Wisconsin State value.
US Value
(16.7%)
The regional value is compared to the national value.
Trend
This comparison measures the indicator’s values over multiple time periods.<br>The Mann-Kendall Test for Statistical Significance is used to evaluate the trend<br>over 4 to 10 periods of measure, subject to data availability and comparability.
