Search for Indicators
Dane County Air Quality Dashboard
Indicator Gauge Icon Legend
Legend Colors
Red is bad, green is good, blue is not statistically different/neutral.
Compared to Distribution
 the value is in the best half of communities.
 the value is in the 2nd worst quarter of communities.
 the value is in the worst quarter of communities.
Compared to Target
 meets target;
  does not meet target.
Compared to a Single Value
 lower than the comparison value;
 higher than the comparison value;
 not statistically different from comparison value.
Trend

 non-significant change over time;
 significant change over time;
  no change over time.
Compared to Prior Value
 higher than the previous measurement period;
 lower than the previous measurement period;
 no statistically different change from previous measurement period.
Health / Respiratory Diseases
Adults with Asthma County: Dane
Adults with Asthma County: Dane
10.5%
(2019-2021)
Compared to:

WI Counties
The distribution is based on data from 49 Wisconsin counties.
WI Value
(10.4%)
The regional value is compared to the Wisconsin State value.
Prior Value
(9.5%)
Prior Value compares a measured value with the previously measured value. Confidence intervals were taken into account in determining the direction of the comparison.
Trend
This comparison measures the indicator’s values over multiple time periods.<br>The Mann-Kendall Test for Statistical Significance is used to evaluate the trend<br>over 4 to 10 periods of measure, subject to data availability and comparability.
Community / Transportation
Solo Drivers with a Long Commute County: Dane
Solo Drivers with a Long Commute County: Dane
24.2%
(2018-2022)
Compared to:


WI Counties
The distribution is based on data from 72 Wisconsin counties.
U.S. Counties
The distribution is based on data from 3,141 U.S. counties and county equivalents.
WI Value
(27.8%)
The regional value is compared to the Wisconsin State value.
US Value
(36.4%)
The regional value is compared to the national value.
Prior Value
(25.0%)
Prior Value compares a measured value with the previously measured value. Confidence intervals were taken into account in determining the direction of the comparison.
Trend
This comparison measures the indicator’s values over multiple time periods.<br>The Mann-Kendall Test for Statistical Significance is used to evaluate the trend<br>over 4 to 10 periods of measure, subject to data availability and comparability.
Workers who Drive Alone to Work County: Dane
Workers who Drive Alone to Work County: Dane
67.1%
(2018-2022)
Compared to:

WI Counties
The distribution is based on data from 72 Wisconsin counties.
U.S. Counties
The distribution is based on data from 3,133 U.S. counties and county equivalents.
WI Value
(77.0%)
The regional value is compared to the Wisconsin State value.
US Value
(71.7%)
The regional value is compared to the national value.
Trend
This comparison measures the indicator’s values over multiple time periods.<br>The Mann-Kendall Test for Statistical Significance is used to evaluate the trend<br>over 4 to 10 periods of measure, subject to data availability and comparability.
Environmental Health / Air
Air Quality Index (% Good) County: Dane
Air Quality Index (% Good) County: Dane
80.0%
(2020)
Compared to:
Prior Value
(79.9%)
Prior Value compares a measured value with the previously measured value. Confidence intervals were not taken into account in determining the direction of the comparison.
Trend
This comparison measures the indicator’s values over multiple time periods.<br>The Mann-Kendall Test for Statistical Significance is used to evaluate the trend<br>over 4 to 10 periods of measure, subject to data availability and comparability.
Air Quality Index (% Moderate) County: Dane
Air Quality Index (% Moderate) County: Dane
19.6%
(2020)
Compared to:
Prior Value
(20.1%)
Prior Value compares a measured value with the previously measured value. Confidence intervals were not taken into account in determining the direction of the comparison.
Trend
This comparison measures the indicator’s values over multiple time periods.<br>The Mann-Kendall Test for Statistical Significance is used to evaluate the trend<br>over 4 to 10 periods of measure, subject to data availability and comparability.
Air Quality Index (% Unhealthy) County: Dane
Air Quality Index (% Unhealthy) County: Dane
0.4%
(2020)
Compared to:


Prior Value
(0.0%)
Prior Value compares a measured value with the previously measured value. Confidence intervals were not taken into account in determining the direction of the comparison.
Trend
This comparison measures the indicator’s values over multiple time periods.<br>The Mann-Kendall Test for Statistical Significance is used to evaluate the trend<br>over 4 to 10 periods of measure, subject to data availability and comparability.
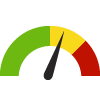
Annual Ozone Air Quality County: Dane
Annual Ozone Air Quality County: Dane
3
(2019-2021)
Compared to:

Air Quality Index
The American Lung Association (ALA) assigns grades A-F to counties (A=1; B=2; C=3; D=4; F=5), based on average annual number of days that ozone levels exceeded U.S. standards during the three year measurement period. The five-point grading scale was used for the distribution (Green = <2; Yellow = 2 - 3; Red = >3). The air quality data is collected by the EPA and summarized by the ALA.
Prior Value
(3)
Prior Value compares a measured value with the previously measured value. Confidence intervals were not taken into account in determining the direction of the comparison.
Trend
This comparison measures the indicator’s values over multiple time periods.<br>The Mann-Kendall Test for Statistical Significance is used to evaluate the trend<br>over 4 to 10 periods of measure, subject to data availability and comparability.
Annual Particle Pollution County: Dane
Annual Particle Pollution County: Dane
1
(2019-2021)
Compared to:
Air Quality Index
The American Lung Association (ALA) assigns grades A-F to counties (A=1; B=2; C=3; D=4; F=5), based on average annual number of days that particle pollution levels exceeded U.S. standards during the three year measurement period. The five-point grading scale was used for the distribution (Green = <2; Yellow = 2 - 3; Red = >3). The air quality data is collected by the EPA and summarized by the ALA.
Prior Value
(2)
Prior Value compares a measured value with the previously measured value. Confidence intervals were not taken into account in determining the direction of the comparison.
Trend
This comparison measures the indicator’s values over multiple time periods.<br>The Mann-Kendall Test for Statistical Significance is used to evaluate the trend<br>over 4 to 10 periods of measure, subject to data availability and comparability.
Recognized Carcinogens Released into Air County: Dane
Recognized Carcinogens Released into Air County: Dane
7,298
Pounds
(2022)
Compared to:
Prior Value
(9,636)
Prior Value compares a measured value with the previously measured value. Confidence intervals were not taken into account in determining the direction of the comparison.
Trend
This comparison measures the indicator’s values over multiple time periods.<br>The Mann-Kendall Test for Statistical Significance is used to evaluate the trend<br>over 4 to 10 periods of measure, subject to data availability and comparability.
Environmental Health / Toxins & Contaminants
PBT Released County: Dane
PBT Released County: Dane
192
Pounds
(2022)
Compared to:
Prior Value
(287)
Prior Value compares a measured value with the previously measured value. Confidence intervals were not taken into account in determining the direction of the comparison.
Trend
This comparison measures the indicator’s values over multiple time periods.<br>The Mann-Kendall Test for Statistical Significance is used to evaluate the trend<br>over 4 to 10 periods of measure, subject to data availability and comparability.
